Analyze Linux Logs

Hello everyone! I'm back after an eternity.

Then, let's dive into the topic.

Errors in Linux can be so hard to find sometime, as you can't see lot of issues with GUI. However Linux has few tools for gathering logs, and with that logs you can find what is going on.
Today I'm here with two tools that is used by Linux for logging.
- dmesg
- journalctl (Yeah... You are right, there is a connection with
systemd.)
But before we start, please refer to my last posts about systemd, If you want to know what systemd is and how it works. And get systemd installed on your system to use journalctl. You can find them here.
journalctl
journalctl is used to query the content of systemd journals.
journalctl? or journald?
journald is the daemon spawned by systemd to collects logs from various log sources. It is also responsible for creation and maintenance of journals that are received from various resources.
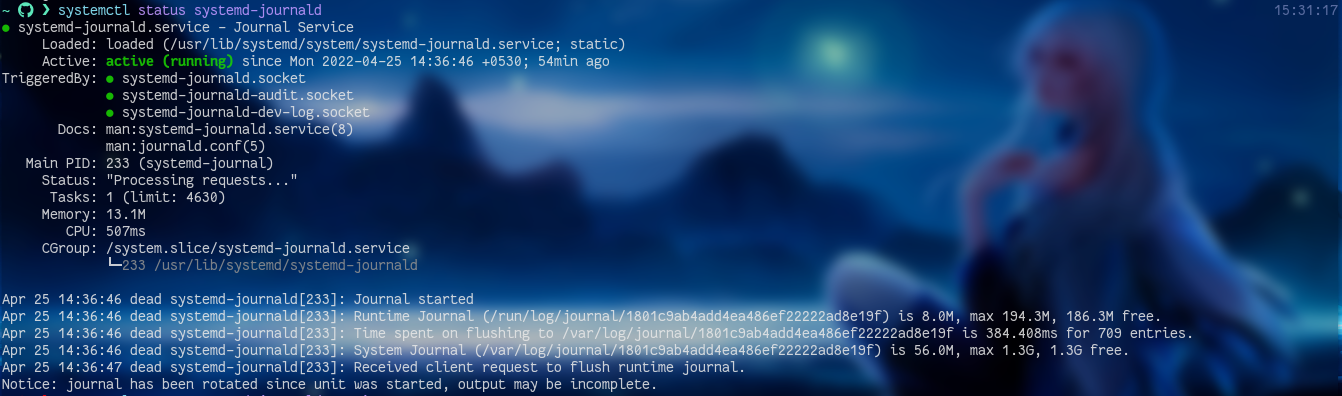
journalctl is the cli-tool that lets you interact with journals created by journald. With journalctl you can read, monitor and filter logs in real time.
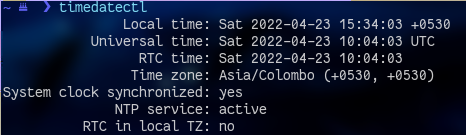
Setting up the System Time
Let me interrupt for a second. The logs are recorded in UTC or local time, and because of that you need to setup your timezone correctly.
systemd suite comes with a handy tool called timedatectl that can help with this.
Follow the steps below to set it up.
timedatectl list-timezones-- This will list the timezones available on your system. Choose a one.sudo timedatectl set-timezone [zone]-- Once you find your timezone, set it up with this command, wherezoneis the timezone you have chosen.timedatectl status-- Execute this (ortimedatectlalone) to ensure that your machine is using the correct time.
journalctl without frills
journalctlcommnad would give the journal logs in chronological order, i.e. they are arranged according to the time. It uses less underneath which means you can use the same keys to move around the logs as you do with less.
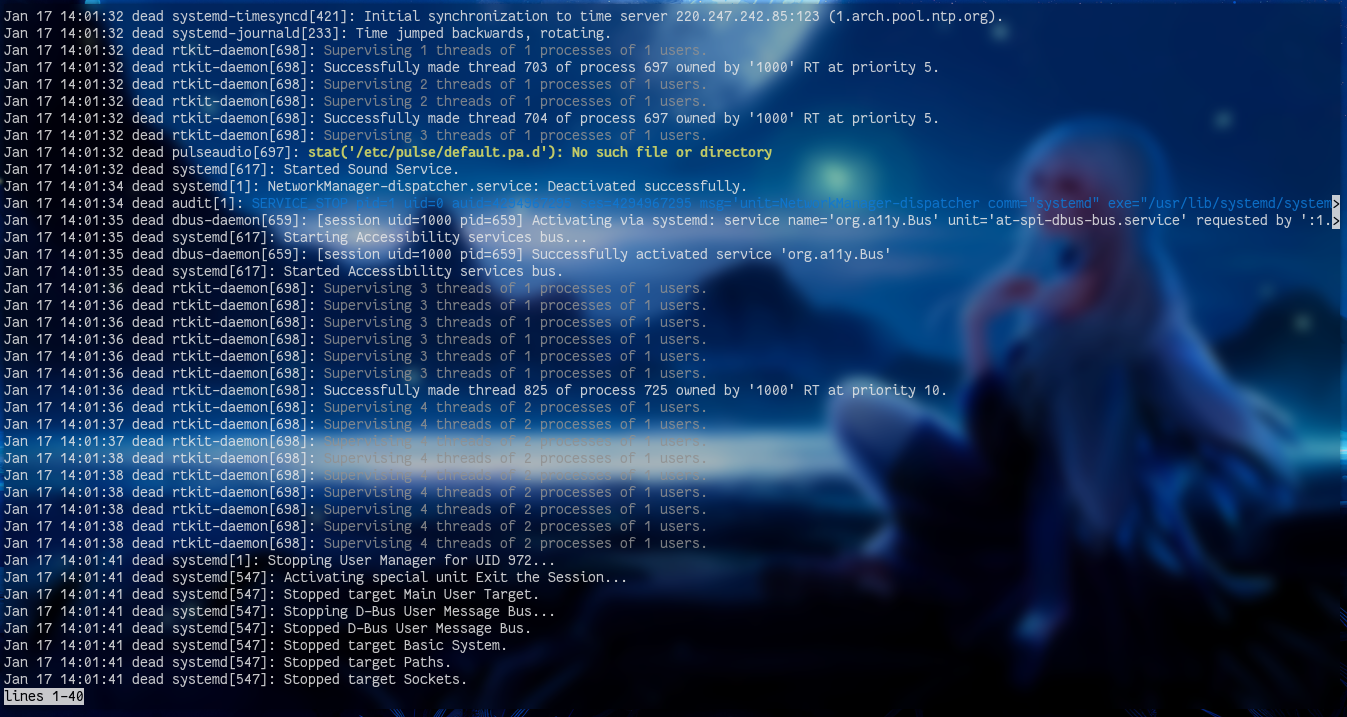
Yet, if you don’t want to see the logs in a less-like order, you can use --no-pager flag.Which display the all logs in the terminal. Trust me though, that would be a mess. Therefore use it with grep.
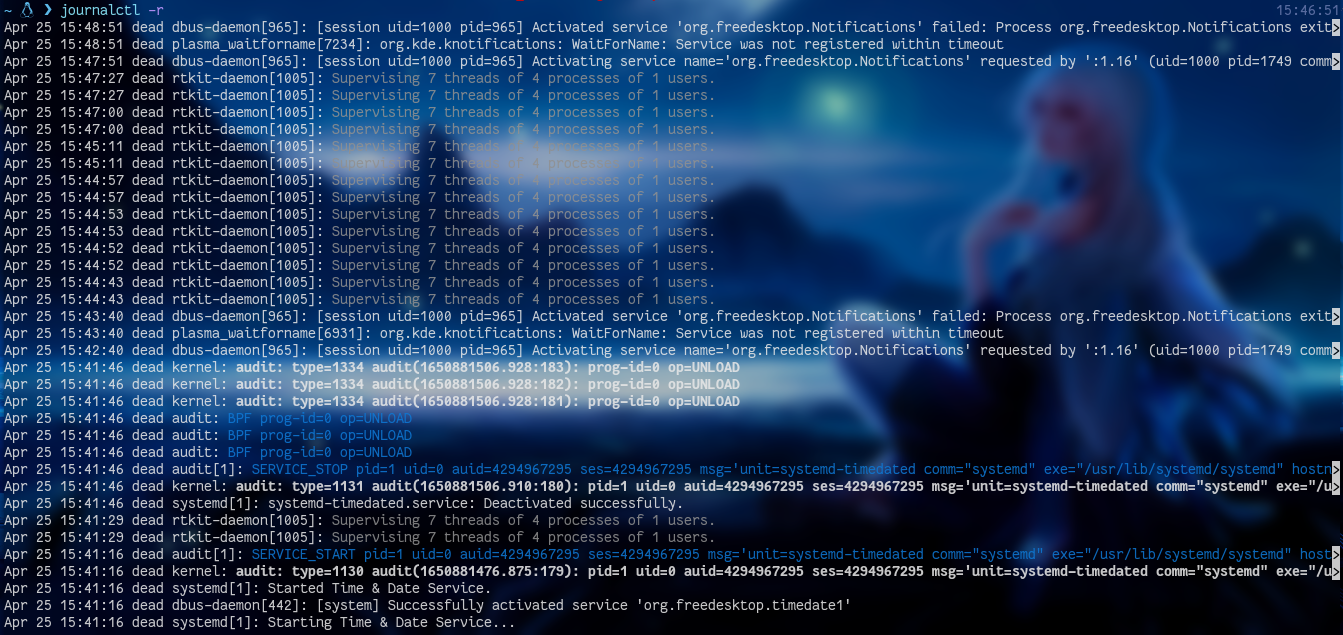
The raw journalctl command gives you the old logs first. However if you want the recent logs to be displayed first you can use --reverse or -r flags to view the logs in reverse order.
filtering the journal logs?
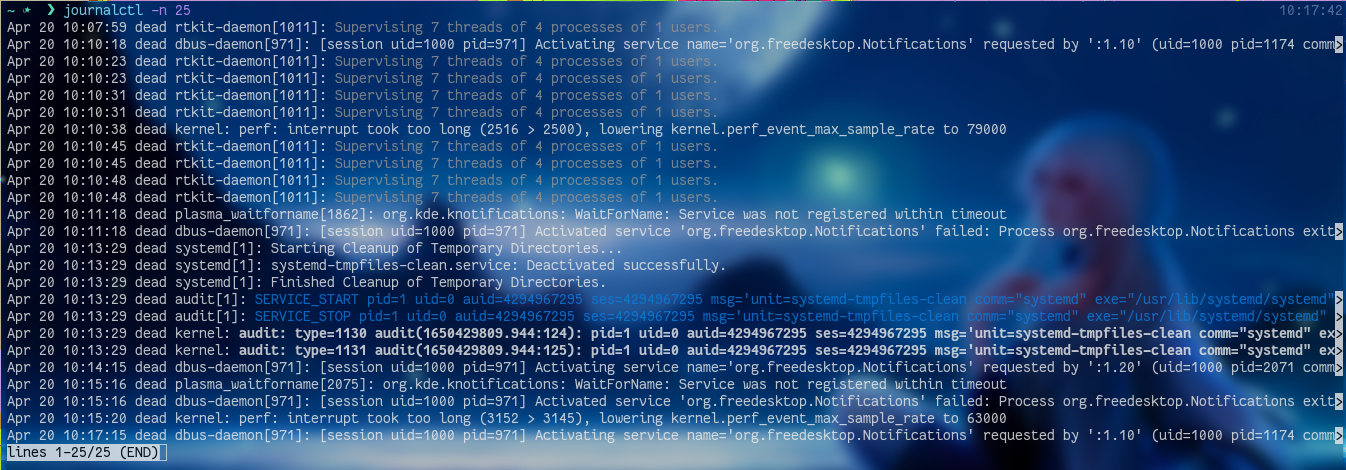
Use -n flag to define the number of the logs you want.
according to a time stamp
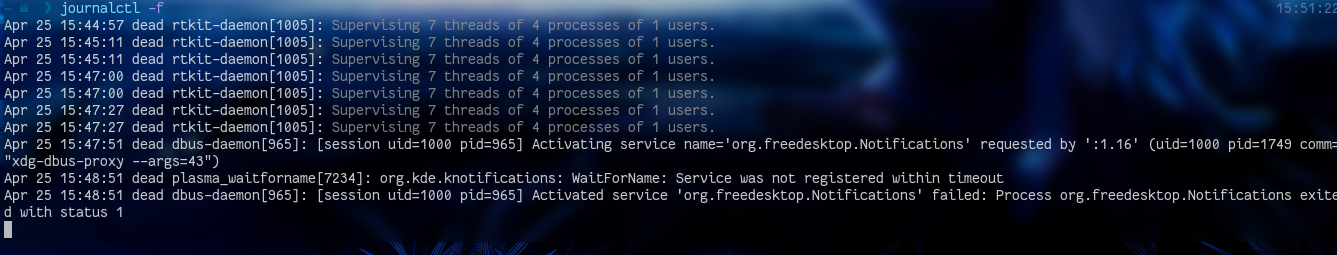
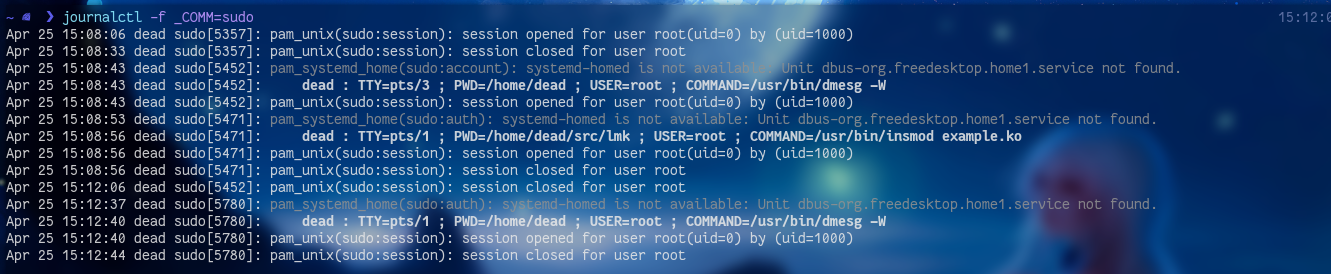
The -f flag would give you the logs in real time, that is it shows the logs that are currently being written.
If you want logs from a specific time period you can use -S and -U flags, which indicates time since and until.
ex: journalctl -S 2022-01-22 -U 2022-01-25 gives you the logs since 22nd of January until 25th.
The relative time is also allowed in journalctl. The h, d, w and m flags specify hours, days, weeks and months respectively.
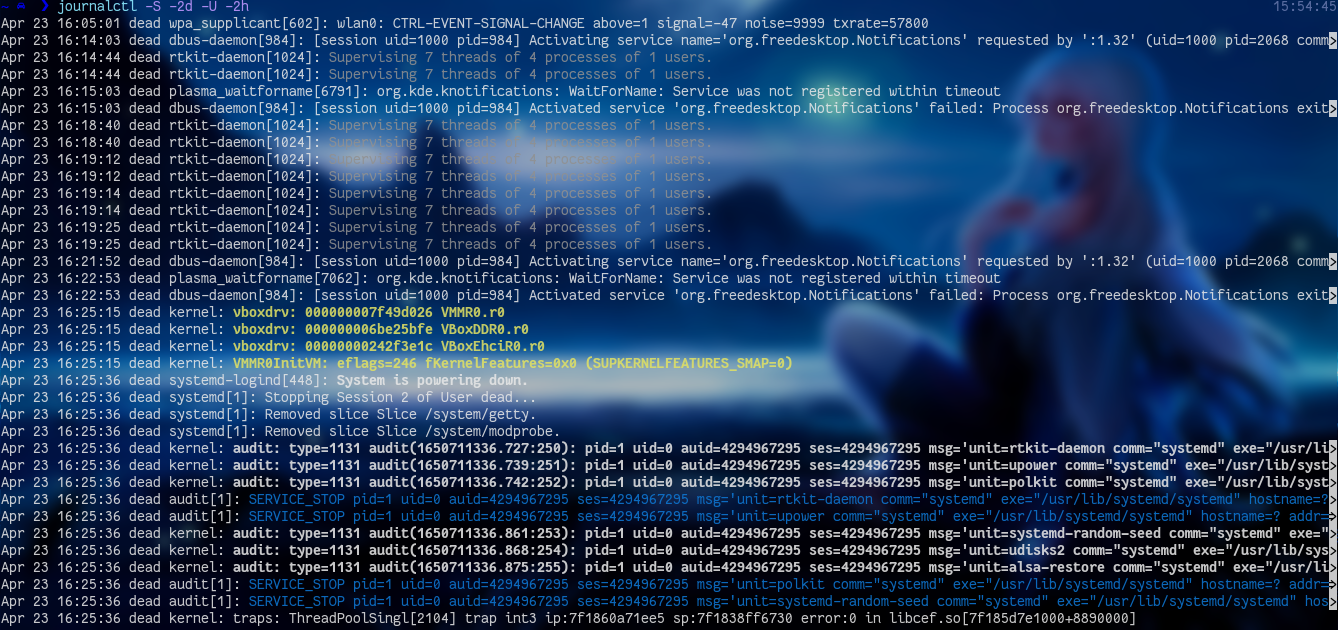
You can also define the time with words using yesterday, today and tomorrow.
with data fields
In order to filter the output with data fields use THEFILED=field-you-want
You’ll find list of data fields here.
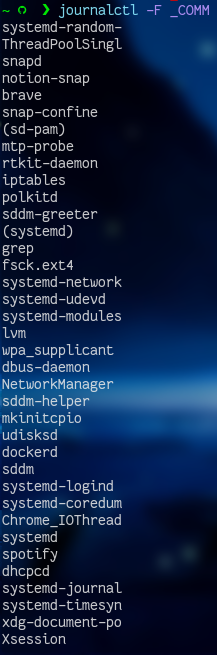
If you want to list out all the values that have been used for a data field you can use -F flag.
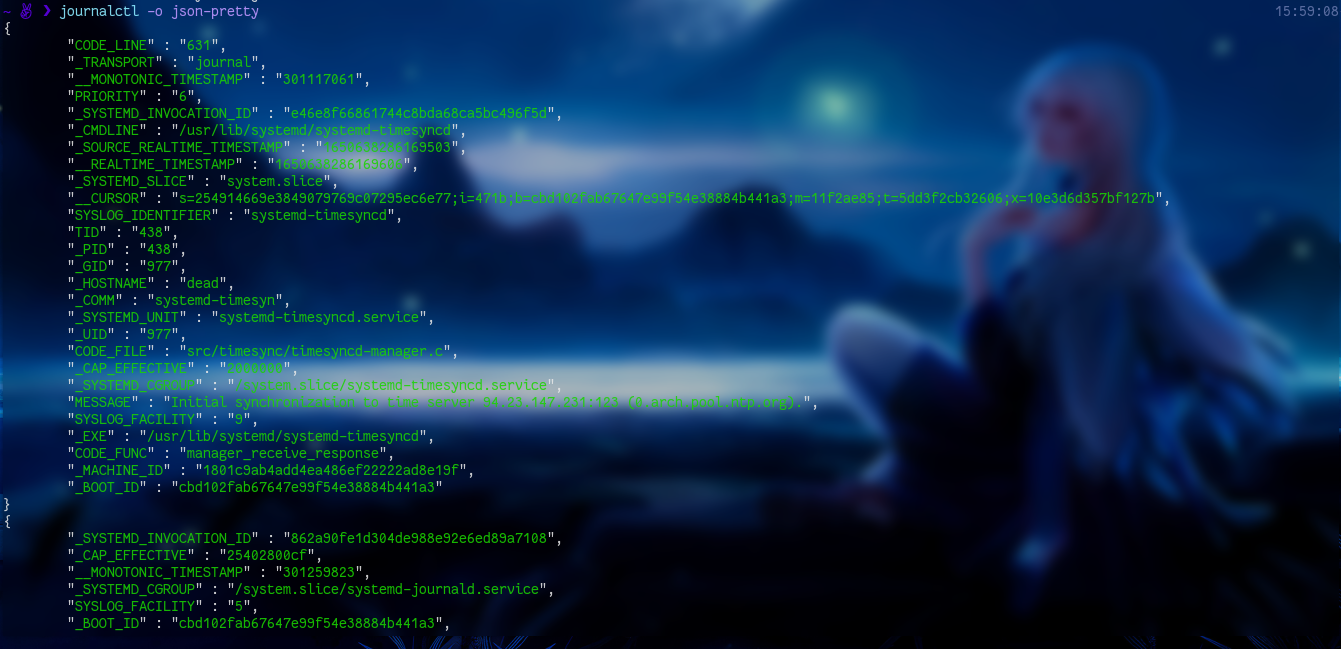
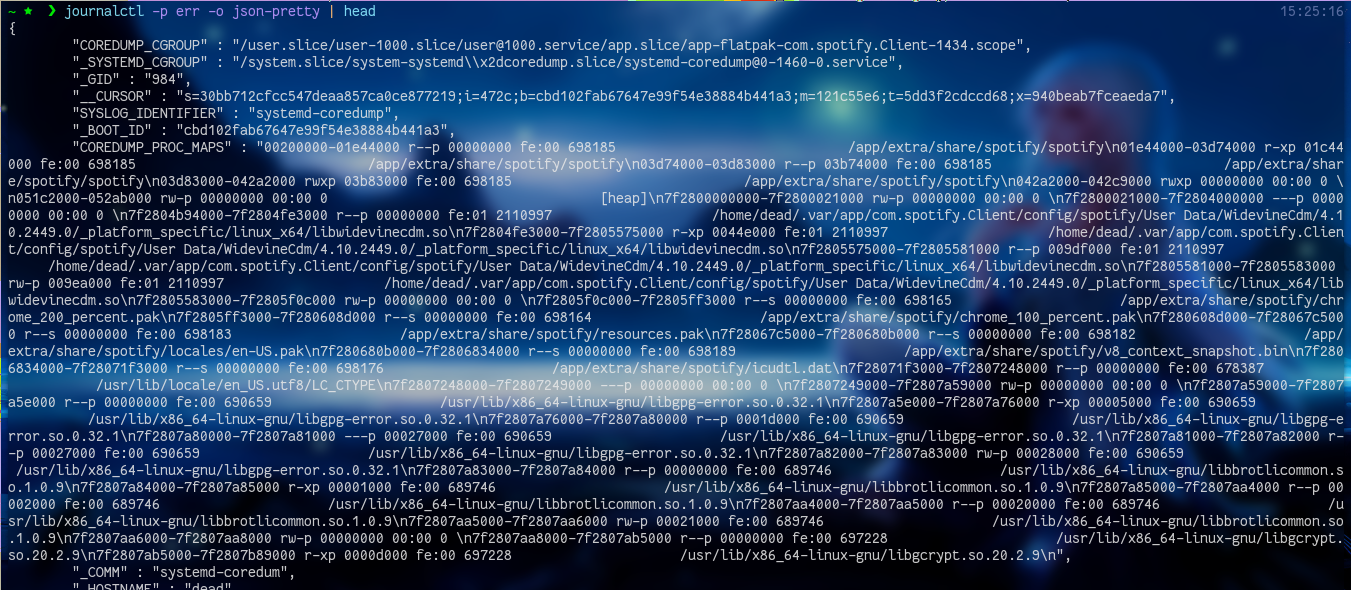
change the output format
Because the journal is a binary file, the data need to be translated into plain text. Thus, we can present the output in different output format.
The -o flag is used define the output format.
Following are some output formats you can use,
- short
- verbose
- export
- json
- cat
- with-unit
PS: you can find a list of formats in the man page also
boot message
If you have got an error relating to the booting process and want to check for that, journalctl have you hold.
The -b flag lists out entries related to each boot. -b without extra filters list the entries of the last boot.
In order to get logs of a specific boot, the boot ID should be prescribed. It can be retrieved using --list-boots flag.
The boot ID is the second one as depicted below.
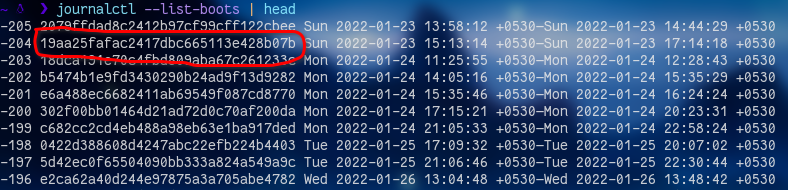
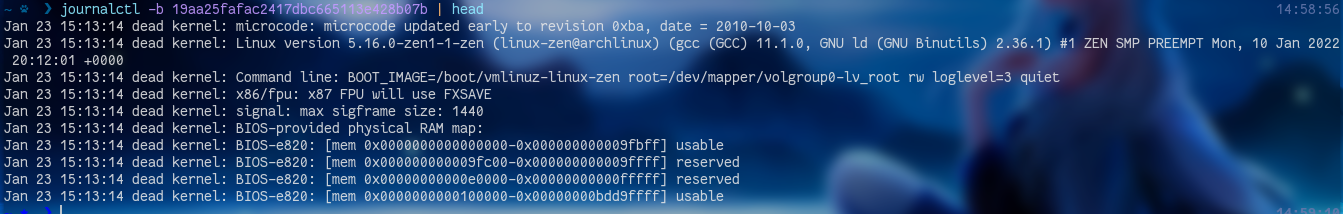
Now just add the identifier, which is the longs number from list-boots after the -b to get the logs of a specific boot.
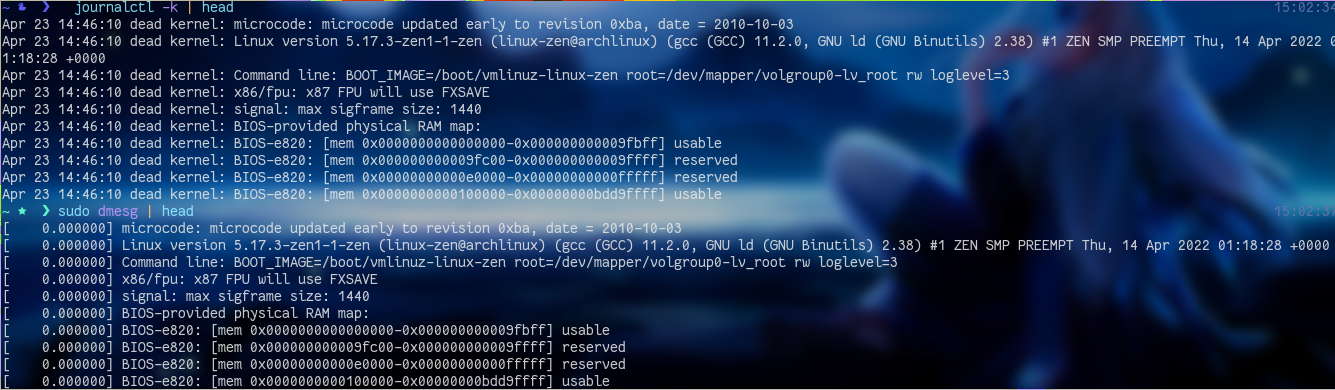
kernel message
The -k flag would give you the kernel messages. This is same as using dmesg.
manage storage
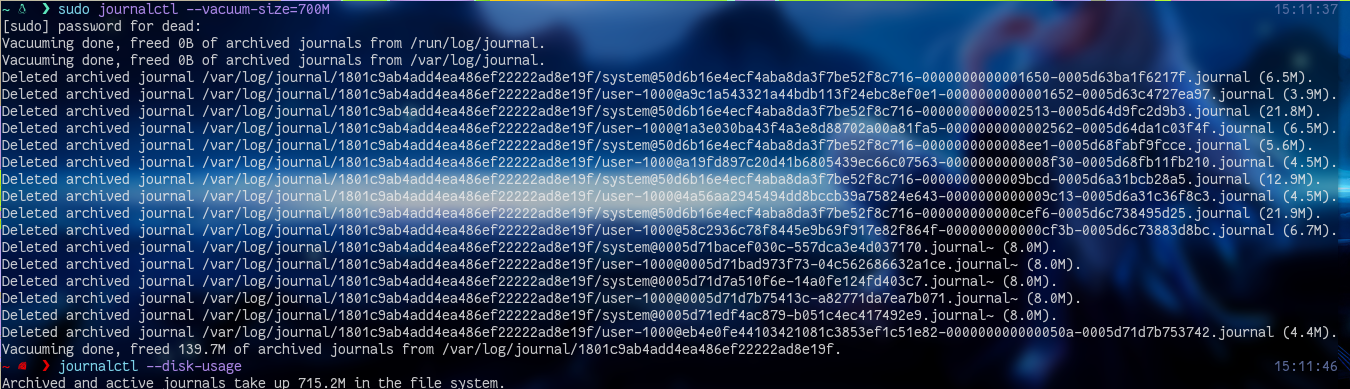
The storage that is used by journalctl can be managed. The --disk-usage command gives you how much storage that’s been used by journals.

You can remove journals that you don’t want with --vacuum flag. --vacuum has three types.
--vacuum-size- deletes until the size provided. This flag is like saying "reduce the journals to this size".
In the below image the size of the journals is almost 800Mb and here journalctl says reduce it to 700Mb.
--vacuum-time= deletes logs that are older than the time provided. The time argument can be same as options for-Sand-Uflags.--vaccum-files= deletes journal files until the provided number.
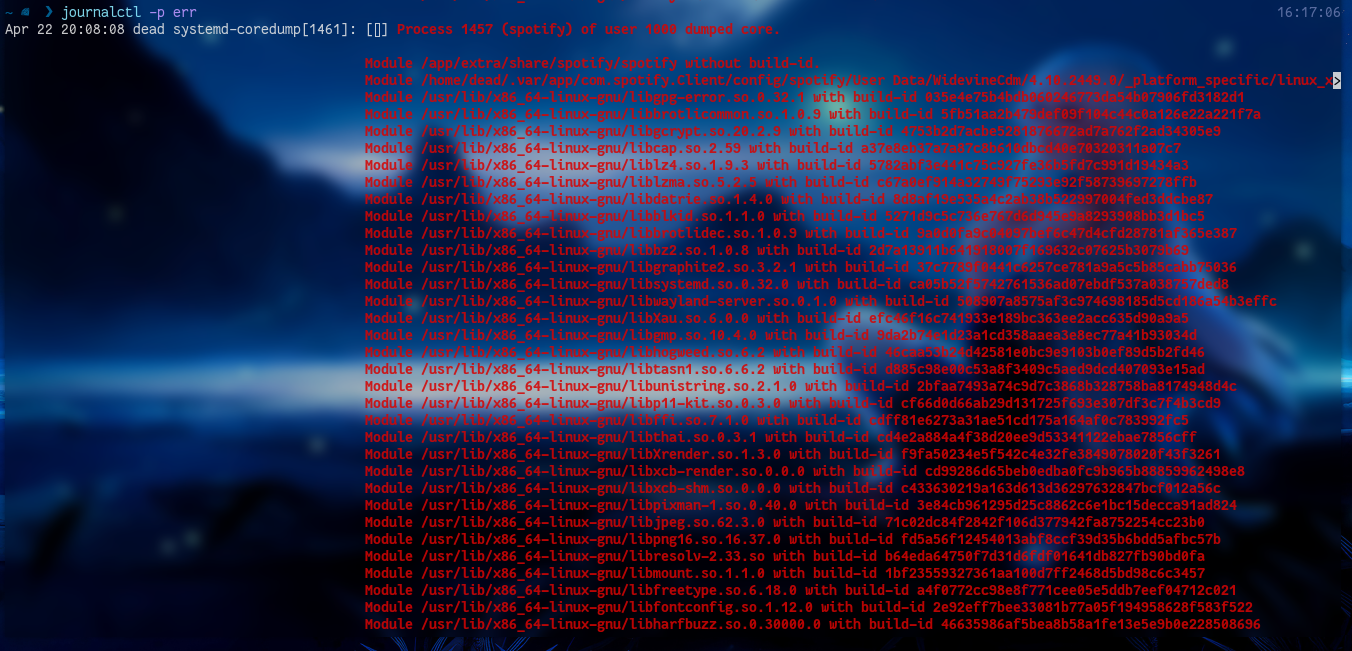
show error, warning logs
The raw journalctl command gives all the logs, means everything with errors, warnings, etc. Yet, you can filter them.
The -p flag in order to list out errors and warnings. You can pass following values for the -p flag.
| # | name |
| 0 | emerg |
| 1 | alert |
| 2 | crit |
| 3 | err |
| 4 | warning |
| 5 | notice |
| 6 | info |
| 7 | debug |
You can use either the number or the name as follow.
Since the log data is stored in a binary format and the data can be displayed in arbitrary output formats, the -o flag can be combined.
dmesg
According to the man page,
dmesg - print or control the kernel ring buffer
Now what is ring buffer?
In a nutshell a ring buffer is a message store, which has messages from the kernel.

The booting processes (BIOS/UEFI and GRUB) start and load the kernel into the memory and then the kernel starts the systemd(or any other init system). Then the startup processes takes the control and initializes the system. In the early stage, logging daemons are not yet started. To overcome the losing notable errors and warnings, kernel uses the ring buffer to store those messages. And dmesg is used to read those messages.
A ring buffer can be thinks as a Queue data structure as it follows the FIFO rule. Since the size of the buffer is fixed, the older messages are deleted.
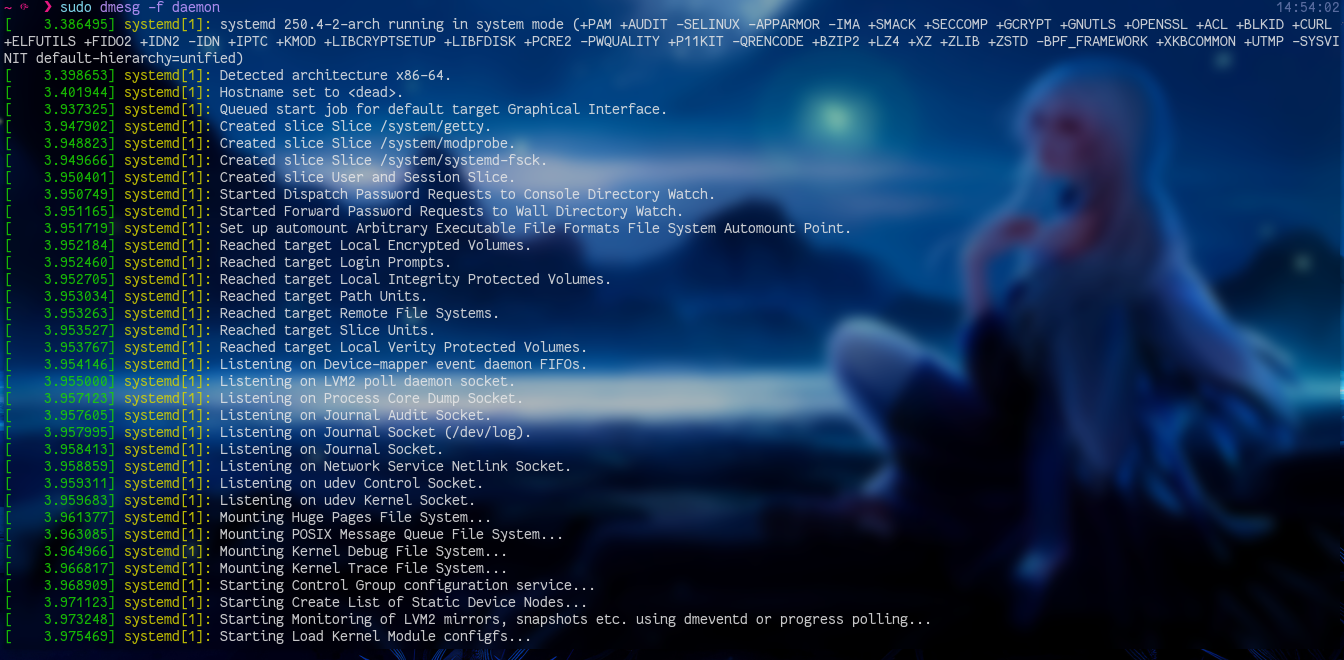
dmesg command
The dmesg command needs to be run with the sudo privileges as we are communicating with the kernel.
dmesg with no flags gives you a long list of messages, and you can pipe it with less in order to make it smaller.
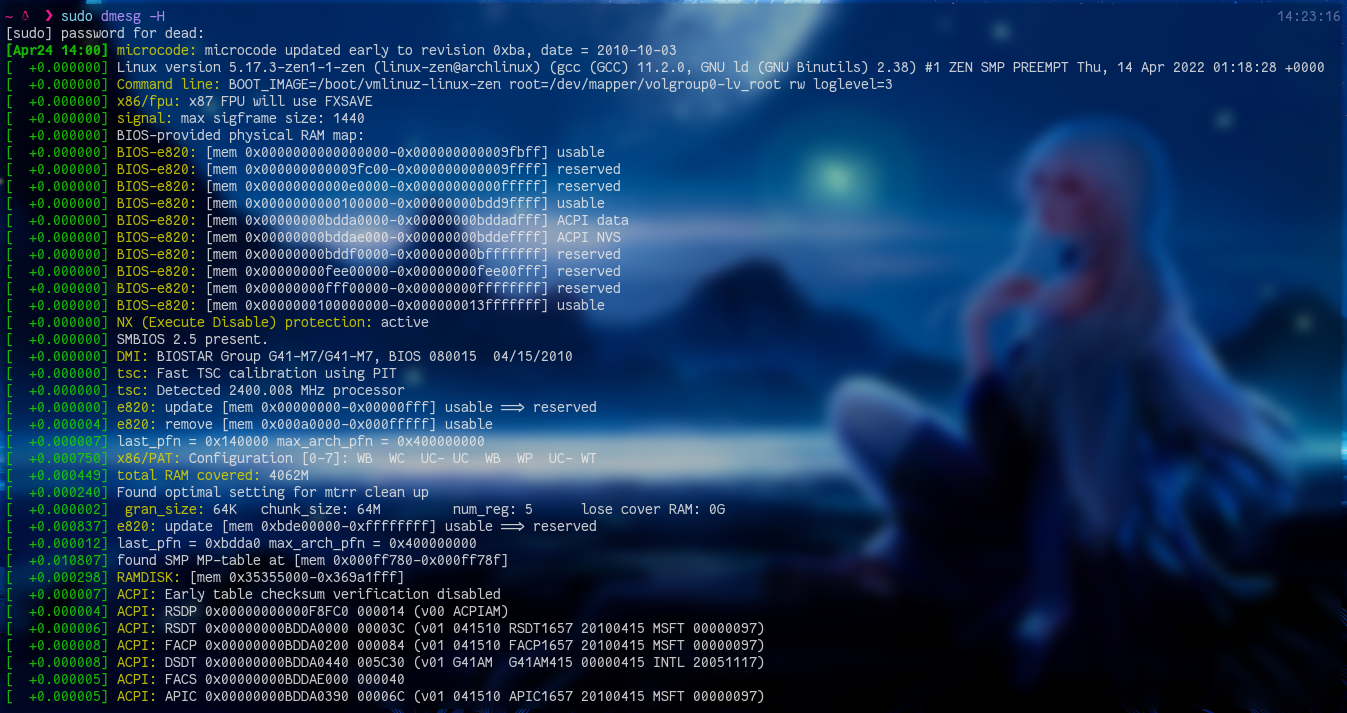
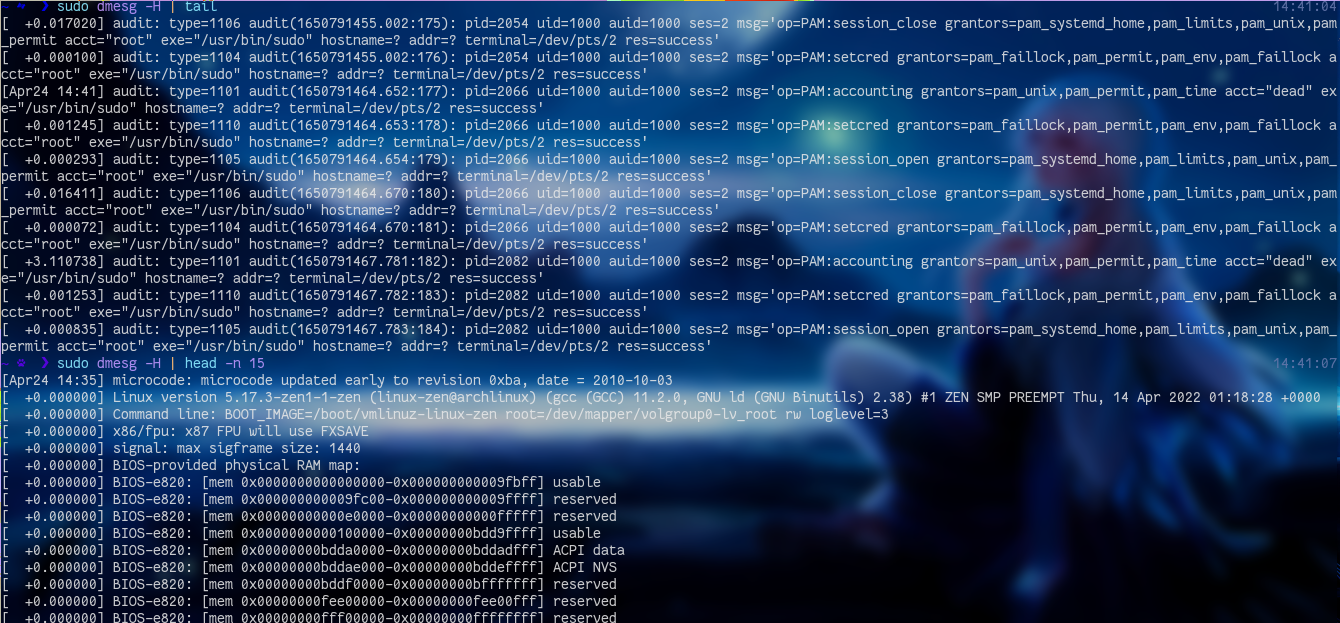
Human readable
By default the dmesg uses seconds and nanoseconds as the time, since the kernel is started. You can make it a human readable output with -H flag. Note that the -H calls the less by default.
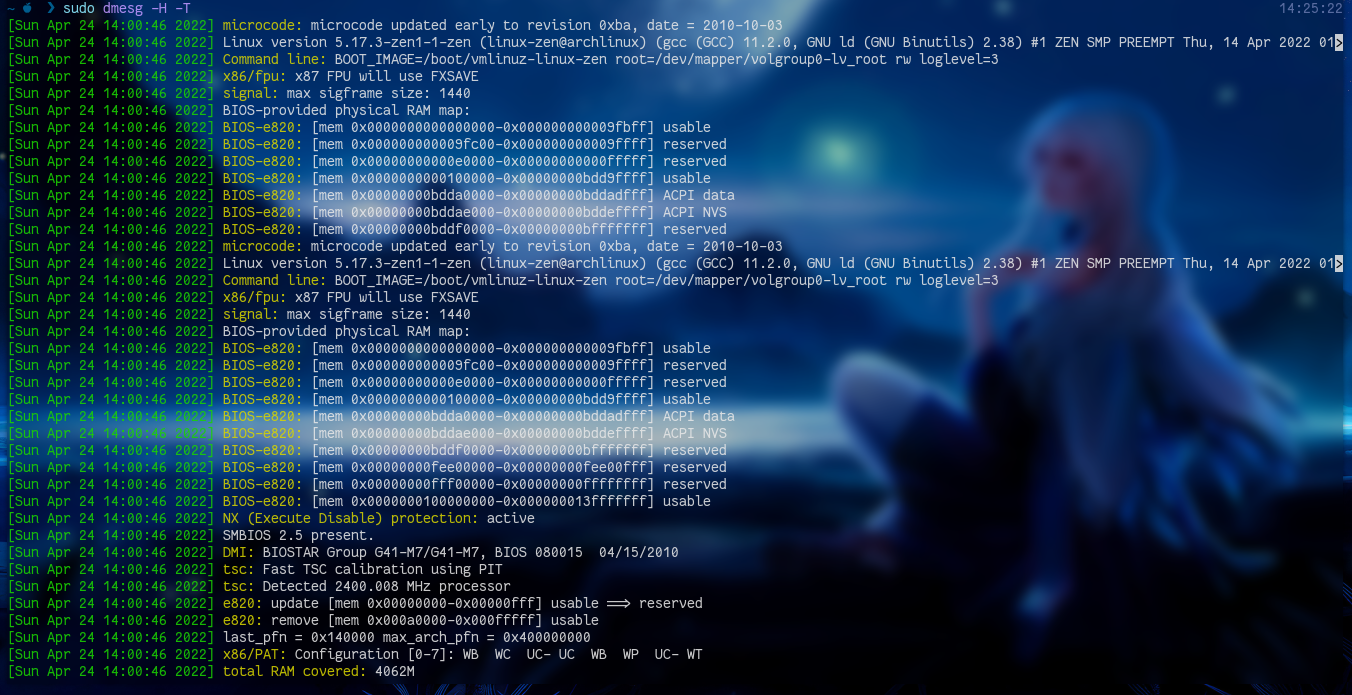
If the seconds are bugging you, you can make it into a full day format with -T flag.
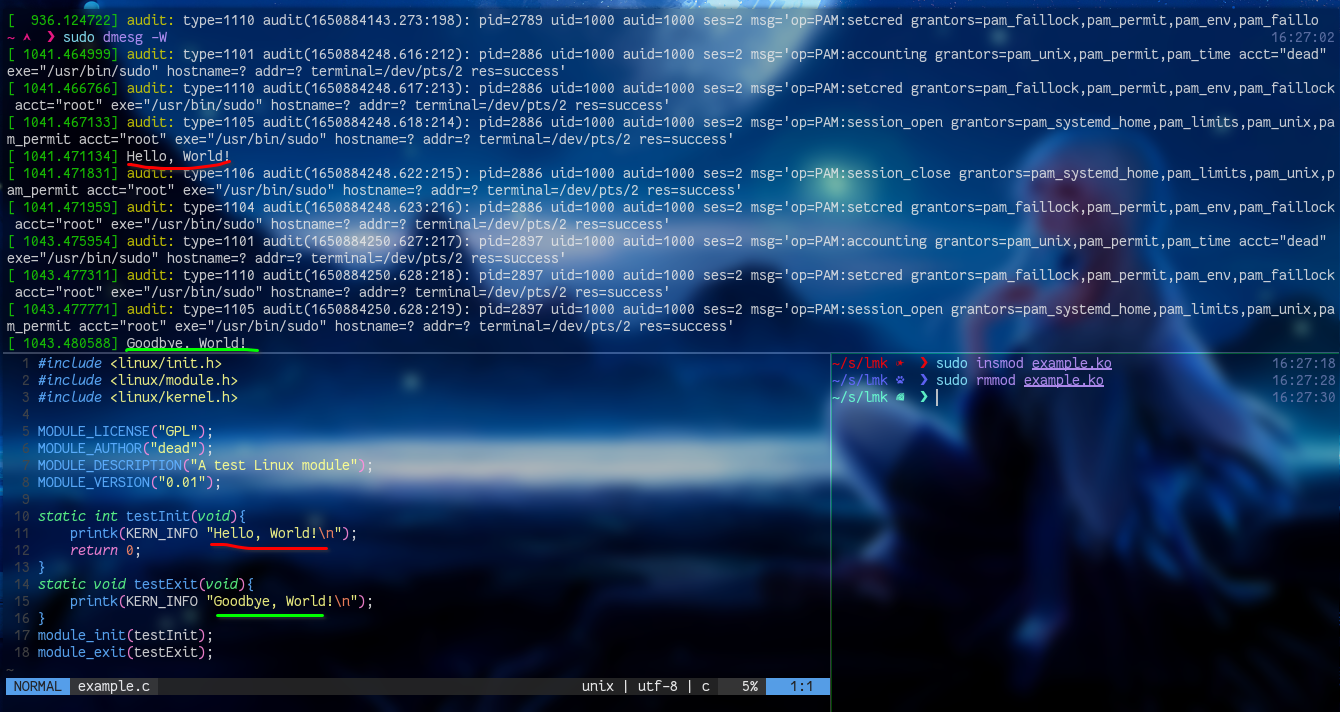
Live Events
You can use --follow or -w to get the kernel messages in real time. And if you only want the new messages you can use -W flag. You can plug a USB, add a kernel module, etc. to see the new kernel messages.
Filtering the output
There are lot of ways to filter the output and following are few.
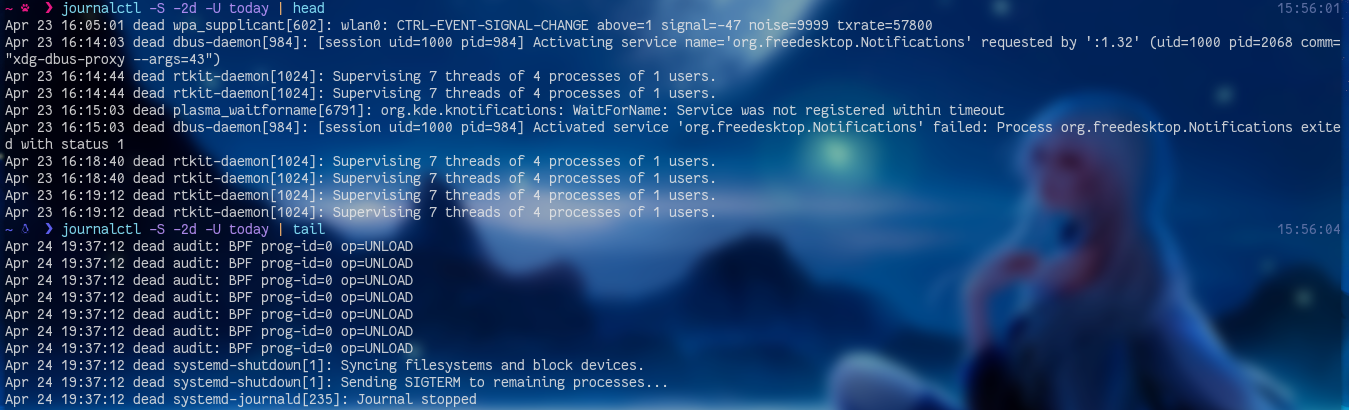
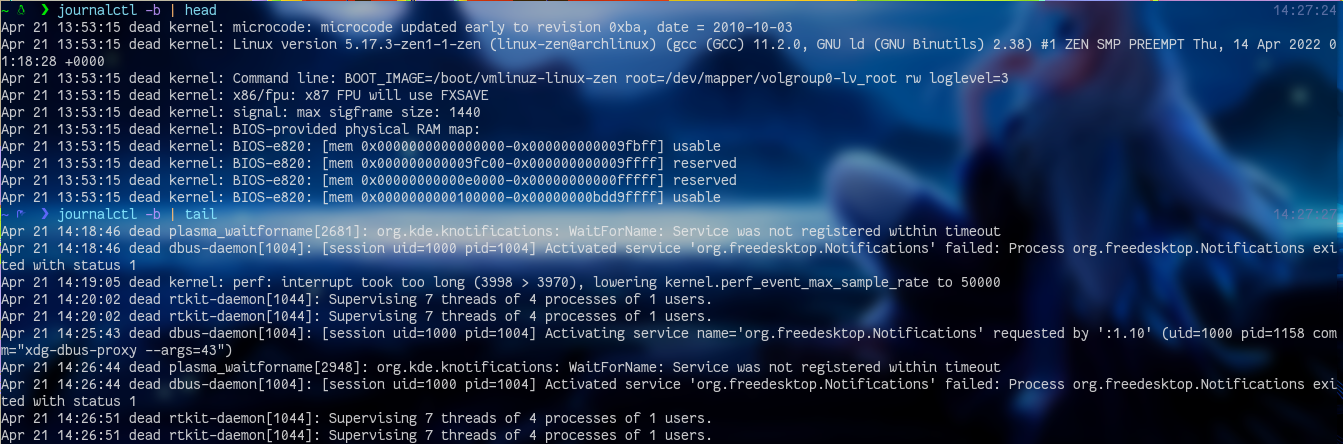
Get specific number of logs
For this there's no built in flag, yet you can use the commands tail and head.
Search for a specific term
The grep can be used for this.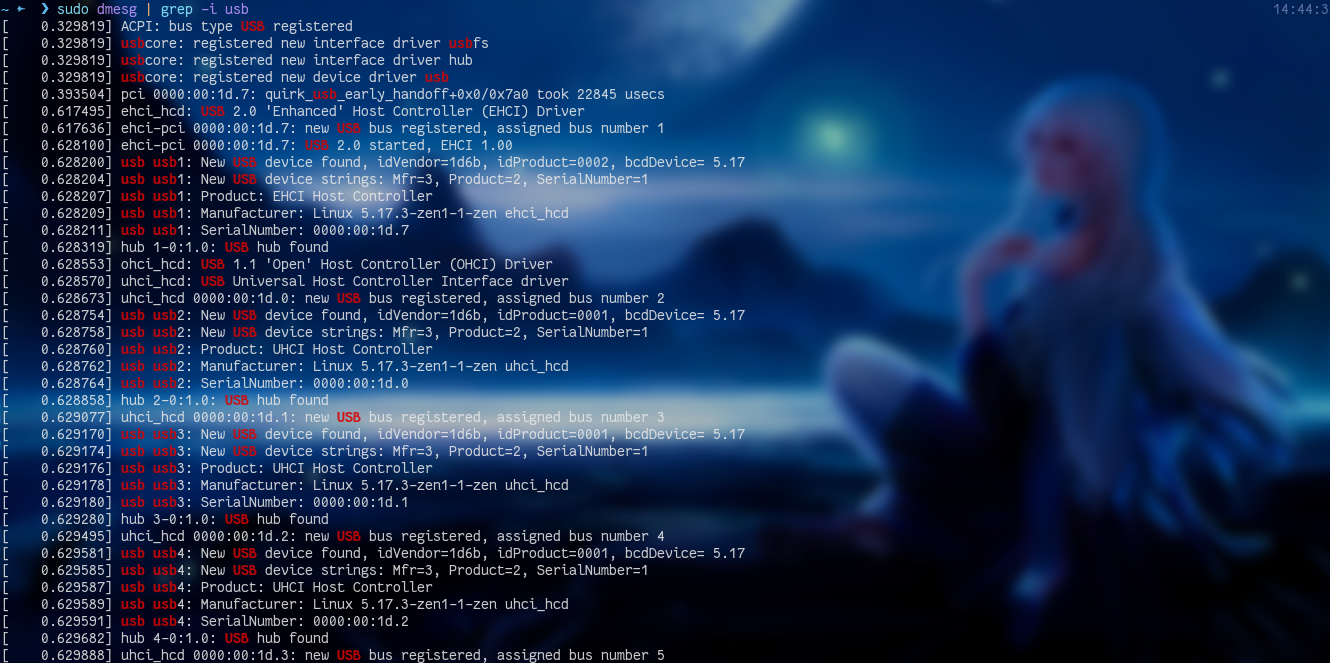
Log levels
Every message logged to the ring buffer has a level, which represents the importance of the information in the message. Those levels can be used to filter the output.
The -l and --level flag is used to provide the level. You can use one or more.
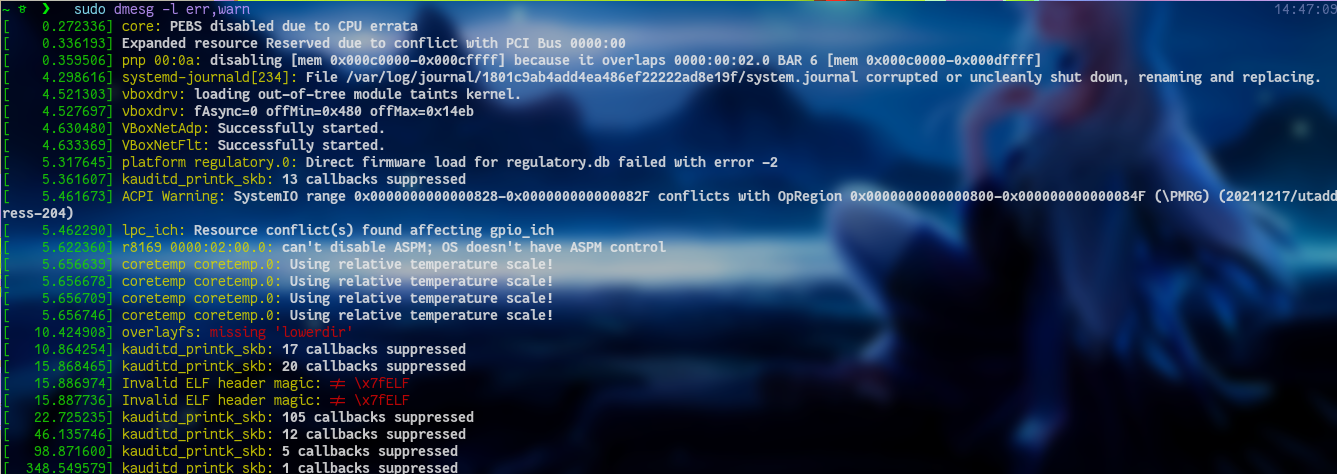
Following are the supported levels;
- emerg - system is unusable
- alert - action must be taken immediately
- crit - critical conditions
- err - error conditions
- warn - warning conditions
- notice - normal but significant condition
- info - informational
- debug - debug-level messages
Log facilities
The logs are grouped into some categories and you can use --follow or -f to list logs according to the category.
Following are the supported facilities;
- kern - kernel messages
- user - random user-level messages
- mail - mail system
- daemon - system daemons
- auth - security/authorization messages
- syslog - messages generated internally by syslogd
- lpr - line printer subsystem
- news - network news subsystem
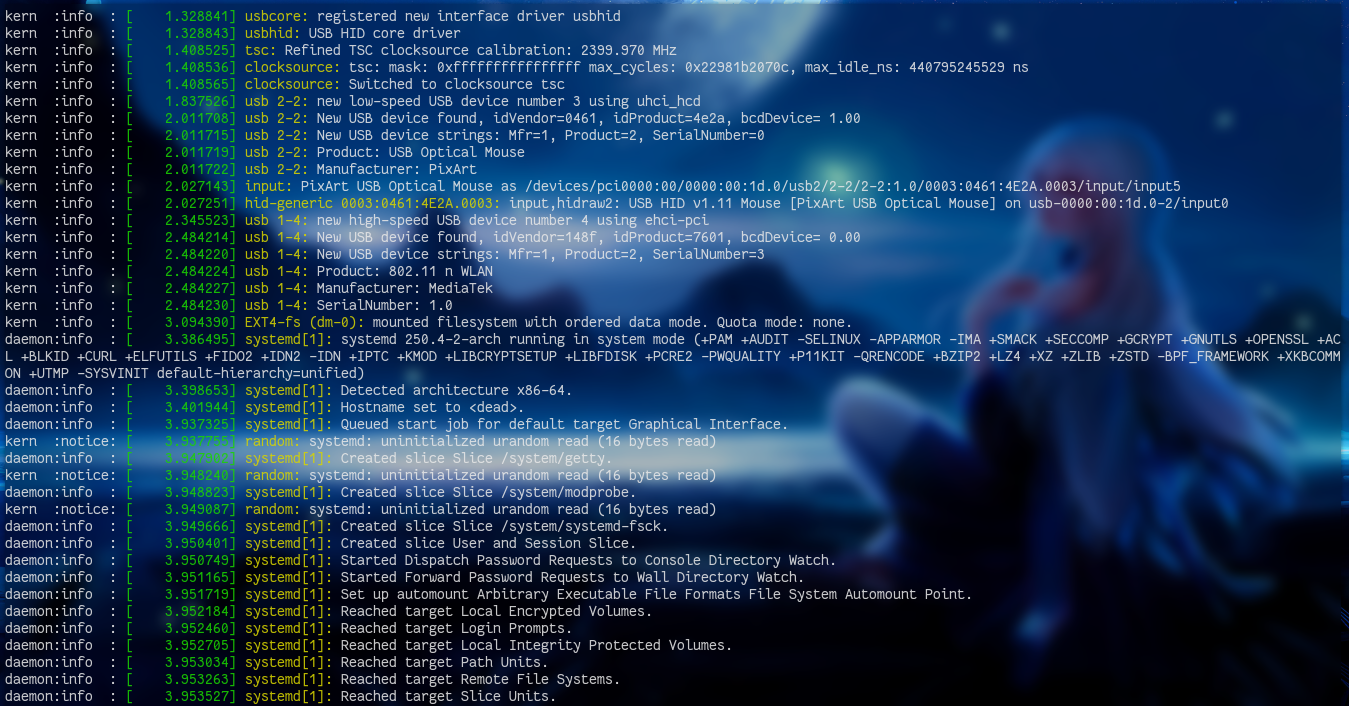
Display the log facility and level
The flag -x list out the corresponding log level and facility before the message.
Conclusion
Thank you for reading! 😊😊 Now go and execute sudo rm -rf /* --no-preserve-root and make tux happy 🐧. Until next time 👋👋👋.
If you find this useful let's connect on Twitter, Instagram, dev.to and Hashnode.


